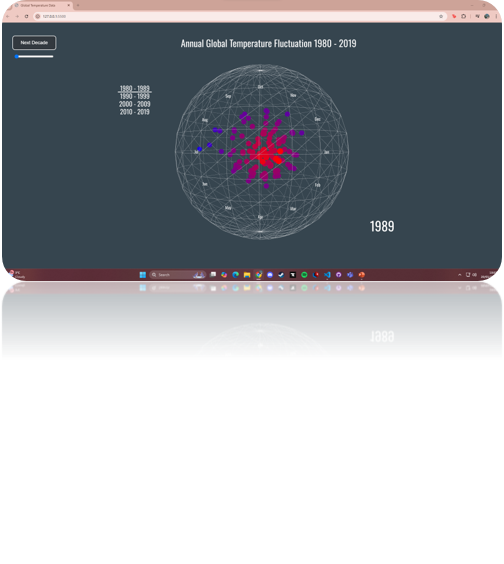
This week, I worked on an algorithmic art piece using p5.js to visualize environmental change, based on global temperature data from a NASA database. Since I had to complete this project on my own, it was quite a challenge, especially with some of the new concepts I had to grasp. One difficulty I faced was not having access to a MIDI controller, which meant I couldn’t experiment with certain types of interactivities like some of my classmates. Instead, I adapted by incorporating mouse-based interaction, allowing users to engage with the visualization in a different way.
Even though there were some features I couldn’t implement, I still learned a lot and built on my existing skills. One of the most useful things I picked up was how to connect external data sources to my code using preload() and CSV files. Working with a predefined dataset for the first time was a valuable learning experience, and I can see this being useful for future projects, especially when dealing with real-world data.
 table = loadTable(
    "Data/data.csv", "csv", "header",
    () => {
      console.log("Data loaded successfully.");
      // Log data array for debugging
      console.log(table.getArray());
      // Check the data for min and max temperatures after the table is loaded
      checkData();
    },
Another key skill I improved was debugging. Since I didn’t have a team to help spot issues, I had to rely heavily on trial and error and console.log() to work through problems. This experience really helped me become more independent in troubleshooting, and I think I’ll be more confident debugging my code in future projects.
Although I enjoyed working on this project, I do think that being part of a team would have helped push the creative side further. It’s always useful to bounce ideas off others, and I might have discovered new techniques or approaches that I hadn’t considered. However, working solo meant I had to problem-solve on my own, which was a great learning experience.
Overall, this task was both challenging and rewarding. It strengthened my ability to work with external data, improved my problem-solving skills, and helped me find alternative ways to implement interactivity when things didn’t go as planned. Going forward, I’d like to explore more interactive elements in my visualizations and find ways to make data-driven art more engaging.