
This week, I worked on creating my own 2D grid artwork, drawing inspiration from my creative research. To build on my understanding, I used the YouTube playlist provided on the VLE, which helped reinforce my knowledge of p5.js. Watching these videos gave me a better grasp of the math behind p5.js and how it’s implemented in creative coding.
The tutorials also introduced me to some useful tips for working in the p5.js web editor, such as how to share my work, adjust settings to suit my needs, and even add files and data. I think these features will be useful for future projects, especially when I start working on the NASA Global Temperature visualization.
I really enjoyed experimenting with 2D grid-based art and seeing how small changes in the code could completely transform the visual outcome. Originally, I wanted to create a piece inspired by Piet Mondrian, but after experimenting, I wasn’t happy with how it looked. Instead, I restarted and took inspiration from the task sheet examples, which use the mouse position to scale the grid cells dynamically. This led me to discover a new technique, which I found exciting.
// Loop Through X and Y Positions to Create the Grid

for (let x = 0; x < width / grid; x++) {

  for (let y = 0; y < height / grid; y++) {
Although I managed to get the artwork working, I don’t fully understand all aspects of the code yet, especially the mathematical side of it. I want to spend more time breaking it down so I can understand it on a deeper level. However, I’m eager to keep learning and experimenting, as I’m really enjoying the combination of art and coding in this project.
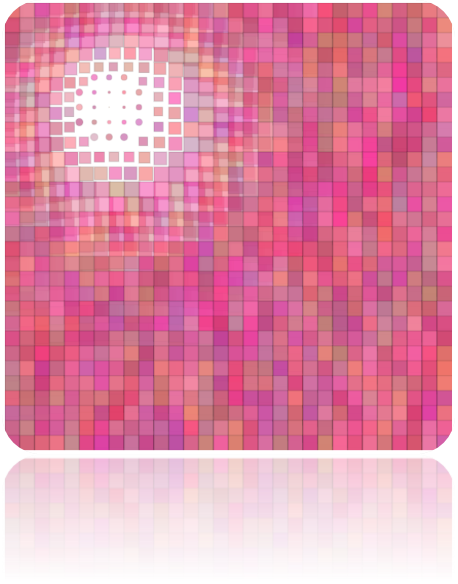
Final Outcome